The Nasdaq 100 staged a strong recovery on Wednesday, climbing over 2.5% after an early session decline, as geopolitical tensions in the Middle East showed signs of cooling.
What Happened?
The recovery was triggered after President Trump confirmed that planned US military strikes against Iran had been called off overnight. He noted that diplomatic talks with Iran were advancing better than anticipated, with key terms of a formal agreement already agreed upon by both sides. Markets responded swiftly — crude oil (WTI) dropped over 4%, moving toward the $85/barrel zone, which helped ease fears of prolonged inflationary pressure.
 Traders monitoring the Nasdaq index amid geopolitical shifts.
Market Sentiment
The CNN Fear & Greed Index, which had been sliding toward "Extreme Fear" territory, stabilized near the 29-point level — still in "fear" but avoiding a deeper plunge. Longer-term investor confidence, however, remains cautious. According to the latest AAII Investor Sentiment Survey (week ending June 10):
- 🟢 Bullish: 30.4%
- ⬜️ Neutral: 22.0%
- 🔴 Bearish: 47.7%
Bearish sentiment has dominated for several weeks, indicating that short-term optimism hasn't yet translated into sustained long-term confidence.
 Market sentiment indicators showing a cautious recovery.
Top Movers in Nasdaq 100
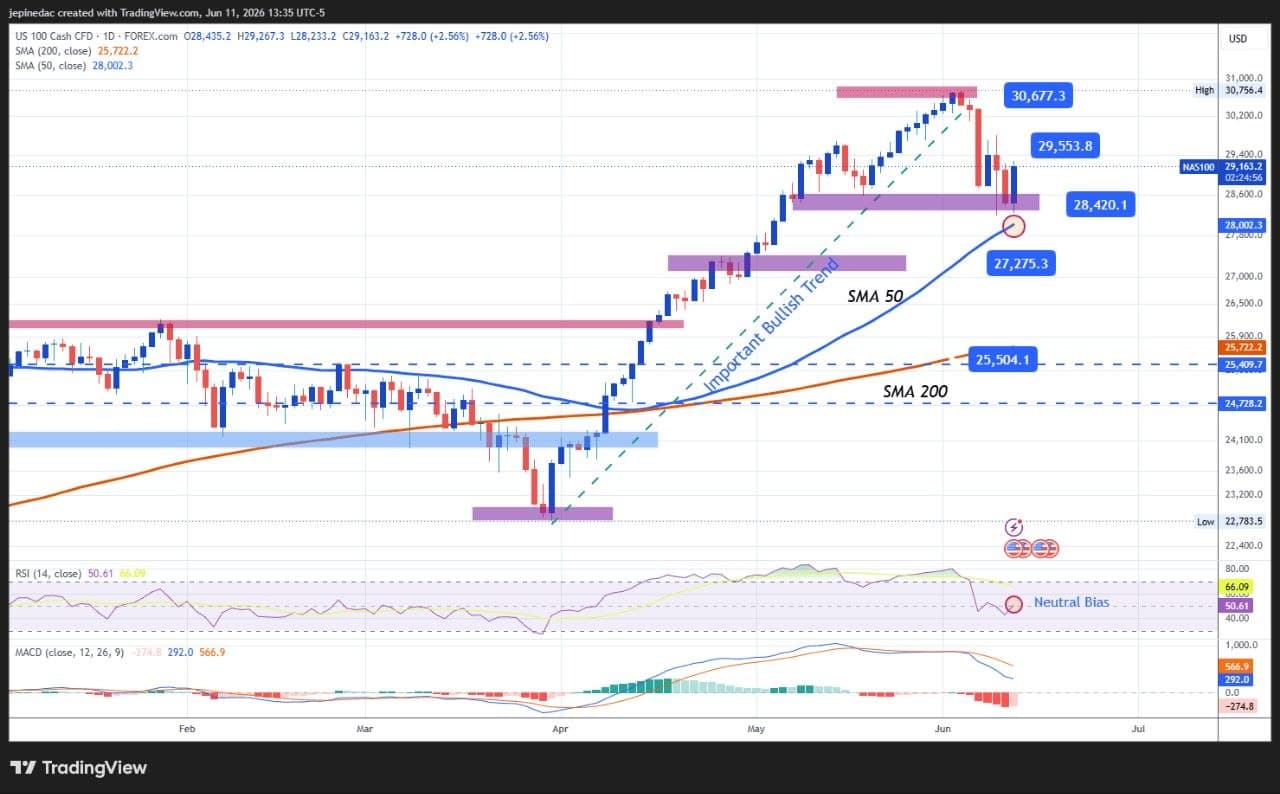
Several major components saw strong gains on the day:
| Stock | Gain |
|---|---|
| Micron Technology (MU) | +6.62% |
| Broadcom (AVGO) | +3.42% |
| Tesla (TSLA) | +3.09% |
| Apple (AAPL) | +1.62% |
| Nvidia (NVDA) | +1.39% |
Technical Outlook
On the daily chart, the Nasdaq 100 broke below its aggressive bullish trendline in recent sessions, signaling a possible indecision phase rather than a clean trend reversal. Key levels to watch:
- 30,677 — Major resistance (all-time high zone)
- 29,554 — Near-term barrier (short-term indecision area)
- 28,420 — Key support (near 50-day SMA; a break below could open bearish momentum)
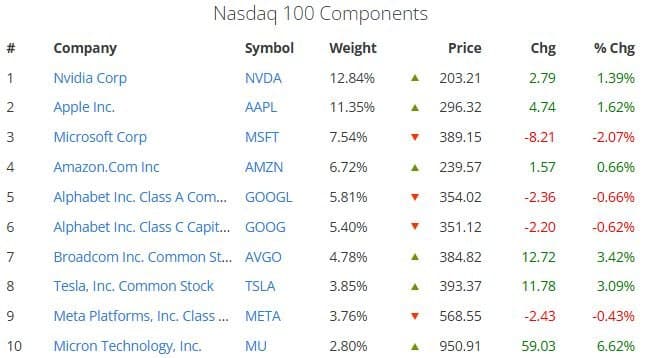 Technical chart highlighting key support and resistance zones.
The MACD histogram is flattening near zero, and RSI is hovering around the neutral 50 level — both confirming a market in balance, not yet committed to either direction.
Bottom Line
The Nasdaq's rebound is encouraging, but it remains dependent on further positive geopolitical developments. With bearish investor sentiment still dominant and technical indicators neutral, the index could stay range-bound unless a formal peace agreement or strong macro catalyst emerges.