
Asset: Gold (XAU/USD)
Current Trading Zone: Around $4,200
Key Technical Levels: Resistance at $4,425 (20-day SMA) | Support at $4,149 & $4,000
Core Drivers: US-Iran Peace Deal Speculations (Islamabad MoU), Hotter US CPI (4.2%) & PPI (6.5%) Data.
The Macro Picture: Geopolitical Optimism Meets Inflation Realities
Gold (XAU/USD) entered a consolidation phase on Friday, stabilizing around the $4,200 handle after a volatile trading week. Bullion recently managed a sharp corrective rebound from its 7-month low of $4,023 up to an intraday high of $4,246, heavily driven by shifting geopolitical sentiments.
US President Donald Trump’s recent statement regarding a potential pause in planned military strikes and the imminence of a US-Iran peace agreement significantly boosted market sentiment. Iranian Foreign Minister Abbas Araghchi further supported this by noting that the Islamabad Memorandum of Understanding (MoU) has "never been closer," though he cautioned media outlets against premature speculation.
However, the upside for the precious metal remains fundamentally capped. This week's critical US economic data delivered a hawkish reality check to the markets:
- Consumer Price Index (CPI): Climbed to 4.2% YoY in May (highest since April 2023).
- Producer Price Index (PPI): Surged to 6.5% YoY (strongest pace since November 2022).
These hot inflation numbers strongly reinforce expectations that the Federal Reserve will maintain its higher-for-longer interest rate stance, preserving the strength of the US Dollar Index (DXY) near 99.78 and placing structural pressure on non-yielding assets like Gold.
Smart Money Analysis: Market Structure & Liquidity Hunt
From an institutional perspective, the recent explosive move in XAU/USD provides a textbook case of algorithmic price delivery and retail liquidity traps.
1. The Judas Swing (Liquidity Sweep)
The sharp spike to $4,246 following the geopolitical headlines was not a true trend reversal. Instead, it acted as a classic Judas Swing designed to harvest the buy-stops of retail breakout traders and short-sellers who placed their stop-losses above the internal resistance levels. Institutions utilized this sudden influx of retail buy orders (liquidity) to fill their heavy institutional sell positions at premium pricing.
2. Market Structure Bias (Bearish)
Despite the headline-driven volatility, the higher-timeframe Market Structure remains firmly bearish. XAU/USD continues to trade cleanly below its 20-day Simple Moving Average (SMA) from the Bollinger Bands situated at approximately $4,425. The Relative Strength Index (RSI) is currently hovering around the 35 level, signaling heavily subdued upside momentum. The elevated Average Directional Index (ADX) near 35 mathematically confirms that the underlying daily downtrend is technically strong.
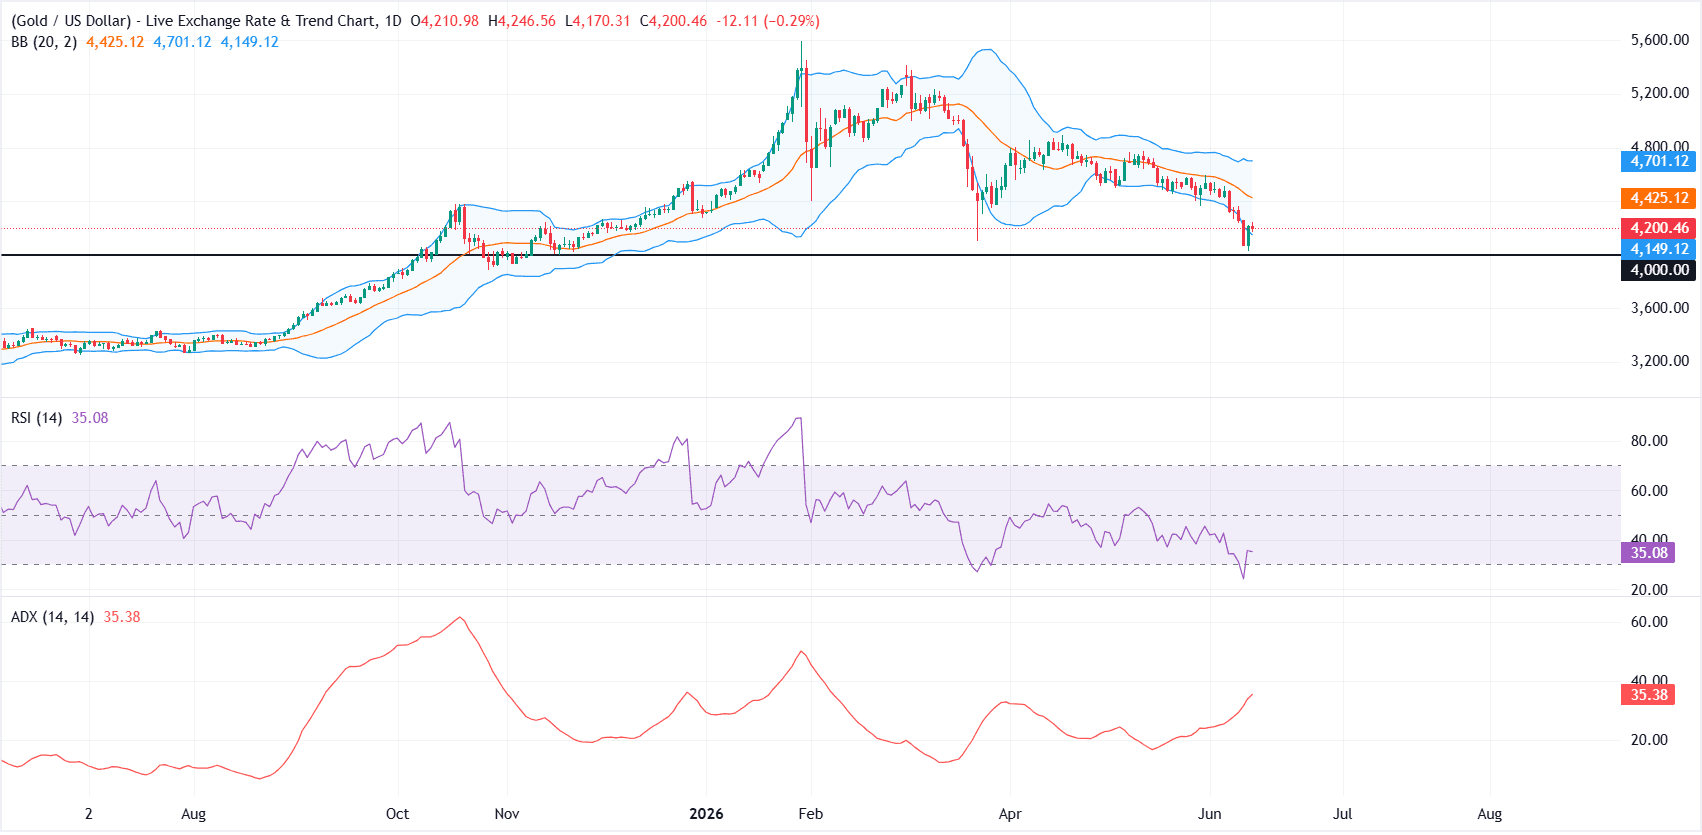 Technical chart highlighting market structure and liquidity pools.
FxBullet Trading Outlook & Takeaway
The Draw on Liquidity: As long as price holds below the structural premium zone of $4,425, the baseline path of least resistance remains to the downside. The next major objective or "draw on liquidity" rests at the lower Bollinger Band around $4,149, followed by the psychological horizontal demand zone at $4,000.
Educational Note: Retail traders often lose capital during high-impact news cycles because they react emotionally to large candlestick expansions. As institutional traders, we do not chase news wicks. We wait for the algorithm to sweep External Liquidity, monitor for a clear Market Structure Shift (MSS) on the lower timeframes, and execute only when price mitigates a valid Fair Value Gap (FVG) or Order Block.
Bottom Line
With the weekend approaching and the market awaiting final confirmation on the US-Iran peace accord, preservation of capital remains the highest priority. Protect your funding, manage your risk parameters precisely, and let the setups develop.